What Is Hydrology?
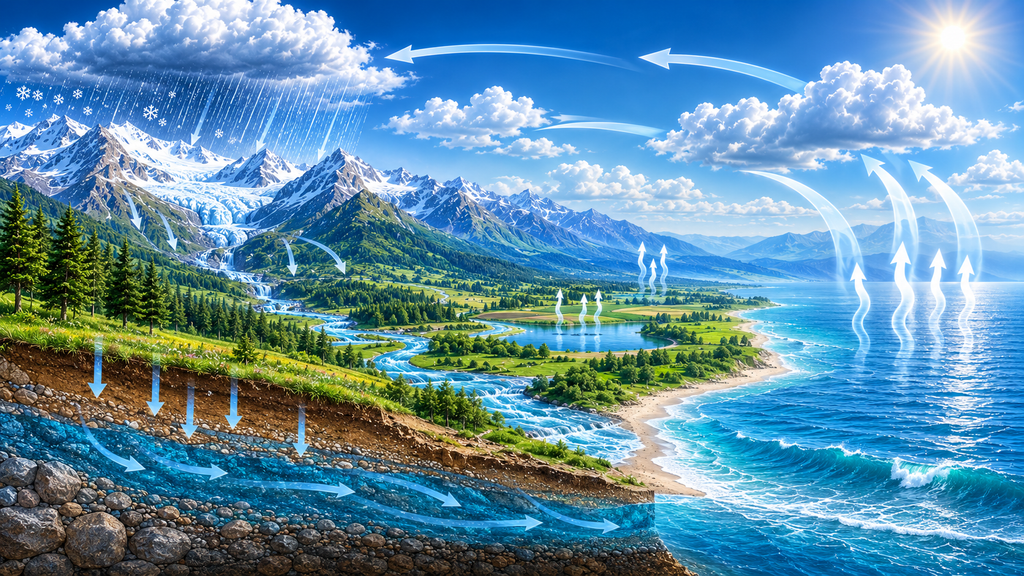
Hydrology is the science of water, its occurrence, distribution, movement and properties on, above and below the Earth’s surface. It examines how water moves continuously between the atmosphere, land, rivers, lakes, oceans, soil and groundwater through the hydrologic cycle.
Hydrology helps us understand how precipitation becomes runoff, how water infiltrates into the soil and recharges groundwater, how rivers respond to rainfall and snowmelt, and how water returns to the atmosphere through evaporation and evapotranspiration.
This understanding is essential for assessing water availability, estimating floods and droughts, designing drainage and hydraulic infrastructure, planning irrigation and reservoirs, managing watersheds and evaluating the effects of land-use and climate variability on water resources.
Hydrology connects rainfall to water availability
Precipitation → Infiltration → Runoff → Streamflow → Groundwater Recharge → Evapotranspiration → Atmosphere
The Hydrologic Cycle: How Water Moves Through Earth
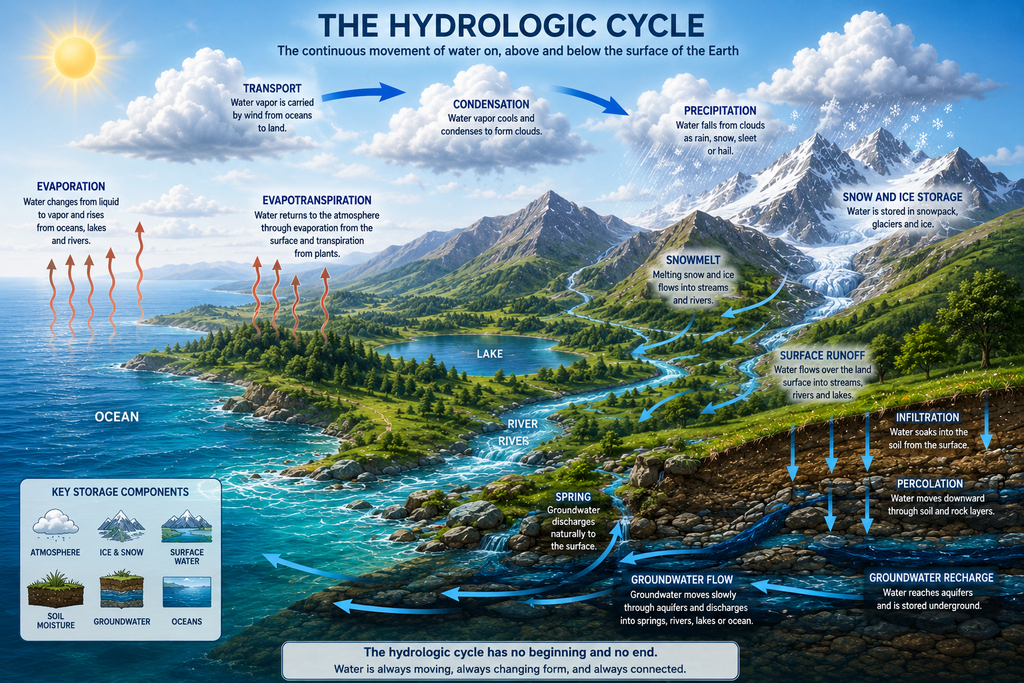
The hydrologic cycle, also known as the water cycle, is the continuous movement of water between the atmosphere, oceans, land surface, rivers, lakes, glaciers, soil and groundwater. Solar energy and gravity drive this circulation, continuously transferring water between different forms and storage locations.
Evaporation & Evapotranspiration
Water evaporates from oceans, lakes, rivers and soil, while plants release water vapour through transpiration. Therefore, the combination of evaporation and plant transpiration is commonly described as evapotranspiration.
Atmospheric Transport & Condensation
The water vapour entering the atmosphere can be transported by atmospheric circulation over considerable distances. Consequently, as moist air cools, water vapour condenses to form clouds.
Precipitation
Water returns from the atmosphere as rain, snow, sleet or hail. In mountainous regions, part of this precipitation may accumulate as seasonal snow or glacier ice before being released later as meltwater.
Infiltration & Percolation
Some water entering the land surface infiltrates into the soil. Water may then move deeper through soil and rock by percolation and eventually contribute to groundwater recharge.
Surface Runoff
Water that does not infiltrate or remain in surface storage may flow over the land as surface runoff, eventually entering streams, rivers, lakes and oceans.
Groundwater Flow
Groundwater moves through aquifers and may eventually discharge into springs, rivers, wetlands, lakes or the ocean, connecting underground and surface-water systems.
Watersheds & Catchments: Where Water Collects and Flows?
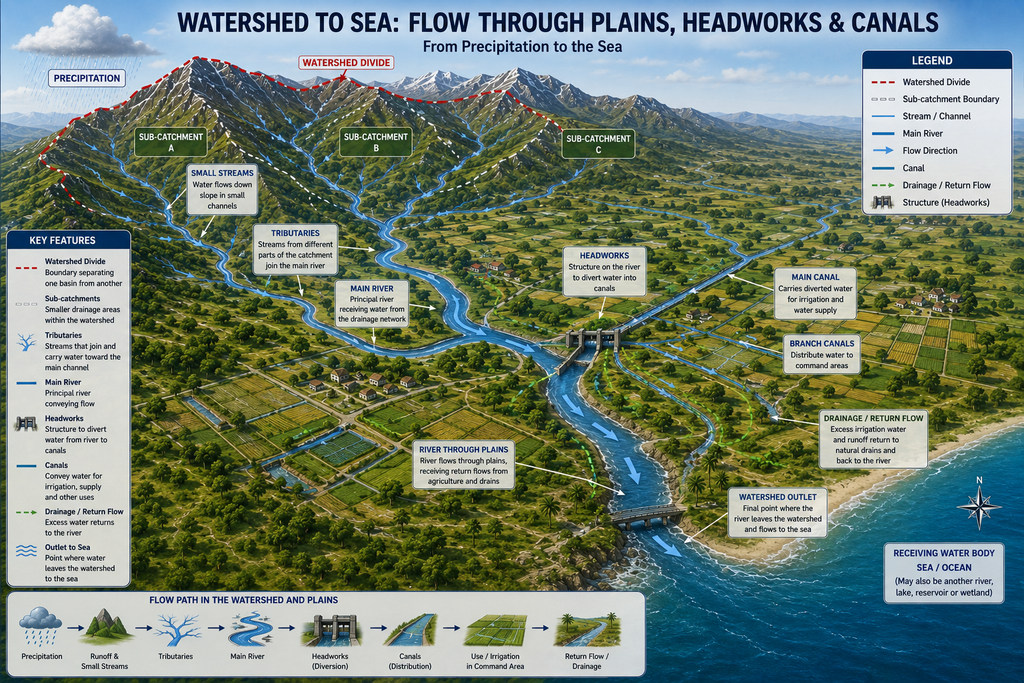
A watershed, also called a catchment or drainage basin, is an area of land from which precipitation and runoff drain toward a common outlet, such as a stream, river, lake or reservoir. In contrast, watersheds are separated from neighbouring drainage areas by elevated terrain known as a watershed divide or drainage divide.
Moreover, rainfall and snowmelt infiltrate soil, recharge groundwater, evaporate, or flow into networks of streams and rivers. Thus, these processes determine how quickly and how much water reaches the watershed outlet.
The hydrologic response of a catchment depends on several factors, including catchment area and shape, topography, slope, soil and geology, land cover, drainage density, rainfall characteristics, antecedent soil moisture and human development. Moreover, understanding these characteristics is fundamental to runoff estimation, flood analysis, reservoir planning, drainage design and watershed management.
Consequently, every point in a watershed ultimately drains toward a common outlet. Thus, Rainfall → Runoff → Next, tributaries feed into the main river. → Main River → Watershed Consequently, every point in a watershed ultimately drains toward a common outlet..
Watershed Divide
The topographic boundary separating one drainage basin from another.
Tributaries
Smaller streams and channels that convey water toward the main river.
Main Channel
The principal river or stream receiving flow from the drainage network.
Outlet
The downstream point where water leaves the watershed, often used for hydrologic analysis and discharge measurement.
What Controls Watershed Response?
Physical Characteristics
- Catchment area
- Shape
- Elevation
- Land slope
- Drainage network
- Soil type
- Geology
Hydrologic & Land-Surface Characteristics
- Rainfall intensity and duration
- Antecedent soil moisture
- Infiltration capacity
- Vegetation
- Land use
- Urbanization
- Surface storage
Nonetheless, two watersheds receiving the same amount of rainfall can produce very different runoff responses. A steep, highly developed catchment with low infiltration may generate rapid and high peak flows, while a vegetated catchment with permeable soils may retain and infiltrate a greater proportion of rainfall.
Precipitation: The Primary Input to Hydrology
Precipitation is the primary input to the hydrologic cycle and includes water falling from the atmosphere as rain, snow, sleet or hail. Its amount, intensity, duration, frequency and spatial distribution strongly influence surface runoff, infiltration, groundwater recharge, river flow, floods and the availability of water within a watershed.
In hydrological analysis, rainfall is not considered only by its total depth. How fast the rain falls, how long it continues, how frequently an event occurs and how widely it is distributed across a catchment can be equally important. A short, high-intensity storm may generate substantial surface runoff and a rapid rise in river discharge, whereas prolonged low-intensity rainfall may allow a greater proportion of water to infiltrate into the soil.
Rainfall characteristics are therefore fundamental to runoff estimation, flood-frequency analysis, drainage design, reservoir studies, irrigation planning, watershed modelling and water-resources assessment.
1. Rainfall Depth
Rainfall depth represents the equivalent depth of water accumulated over a horizontal surface.
Where:
P = precipitation depth
V = volume of precipitation
A = catchment or collection area
For a catchment:
This simple relationship is useful for converting rainfall depth into the total volume of water falling over a watershed.
2. Rainfall Intensity
Rainfall intensity expresses rainfall depth per unit time:
Where:
i = average rainfall intensity, usually mm/hr
P = rainfall depth, mm
t = rainfall duration, hr
Rainfall intensity is a key parameter in stormwater, drainage and flood analysis because short-duration intense storms can generate rapid runoff and high peak discharges.
3. Average Rainfall Over a Catchment
Arithmetic Mean Method
Thiessen Polygon Method
Where:
PiP_i = rainfall at station i
AiA_i = area represented by station i
A = total catchment area
Isohyetal Method
where represents the average rainfall between successive isohyets.
Arithmetic Mean | Thiessen Polygons | Isohyetal Method
4. Hyetograph
A hyetograph shows how rainfall intensity or rainfall depth varies with time during a storm.
Visually:
Y-axis: Rainfall intensity (mm/hr)
X-axis: Time
5. Cumulative Rainfall — Mass Curve
The rainfall mass curve plots accumulated precipitation against time.
The slope of the mass curve represents rainfall intensity. A steep portion indicates intense rainfall, while a flatter portion represents lower intensity.
6. Intensity–Duration–Frequency (IDF) Curves
This deserves special attention because it is a major engineering application of rainfall analysis.
An IDF relationship expresses rainfall intensity as a function of storm duration and return period. A commonly used generalized empirical form is:
Where:
i = rainfall intensity
t = rainfall duration
a, b, c = locally calibrated coefficients
The exact form and coefficients vary by location and adopted methodology, so we should not present one universal IDF equation as applicable everywhere.
2-year
5-year
10-year
25-year
50-year
100-year return period
with:
X-axis → Duration (minutes or hours)
Y-axis → Rainfall intensity (mm/hr)
The important visual relationship is:
Longer duration → generally lower average intensity
Higher return period → generally higher design intensity
7. Return Period & Probability
or
Where:
T = return period in years
p = annual exceedance probability.
For example, a 100-year event corresponds to an annual exceedance probability of:
A 100-year rainfall does not mean that it occurs exactly once every 100 years. It means there is a 1% probability of that magnitude being equal led or exceeded in any given year, under the assumptions of the frequency model.
8. Probability of Occurrence Over Several Years
For engineering design:
Where:
P = probability of at least one exceedance during the period
T = return period
n = number of years.
Infiltration & Groundwater Recharge
What Is Infiltration?
Infiltration is the process by which water at the ground surface enters the soil. Once water has infiltrated, part may remain as soil moisture, part may be used by vegetation, and part may move downward through the soil and underlying geological formations as percolation, eventually contributing to groundwater recharge.
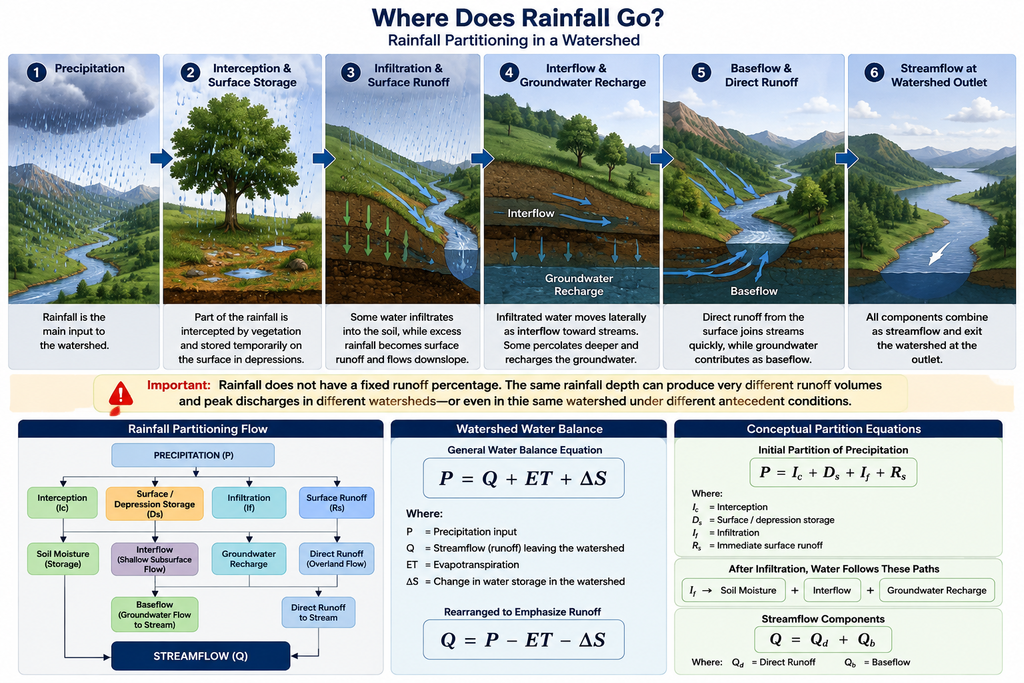
The infiltration rate varies with soil texture and structure, initial soil moisture, vegetation, land use, surface condition, rainfall intensity, slope and soil compaction. When rainfall intensity exceeds the soil’s infiltration capacity, excess water may accumulate at the surface and contribute to surface runoff.
Simple water-partition concept
Where:
P = precipitation
I = infiltration
R = runoff
ET = evapotranspiration
ΔS = change in surface/soil-water storage
This is a simplified event water-balance representation; the exact balance depends on the system boundary and time period.
Infiltration Rate & Infiltration Capacity
We should distinguish these two terms:
Infiltration rate is the actual rate at which water enters the soil, while infiltration capacity is the maximum rate at which the soil can absorb water under the prevailing conditions.
A useful conceptual relationship is:
Where:
f = actual infiltration rate
i = rainfall intensity
fᶜ = infiltration capacity
Therefore:
If i<fci < f_c → rainfall can generally infiltrate without infiltration-excess runoff.
If i>fci > f_c → rainfall exceeds infiltration capacity and the excess can contribute to surface runoff, subject to storage and other losses.
Horton Infiltration Equation
Horton Infiltration Equation
Where:
f(t)f(t) = infiltration capacity at time
f0f_0 = initial infiltration capacity
fcf_c = final or equilibrium infiltration capacity
kk = decay constant
tt = time
Green-Ampt Infiltration Mode
The Green-Ampt model represents infiltration by assuming a distinct wetting front moving downward through the soil. It relates infiltration to soil hydraulic conductivity, moisture deficit and suction at the wetting front.
Groundwater Recharge
From Infiltration to Aquifer Recharge
Not all infiltrated water becomes groundwater recharge. Some is retained as soil moisture and subsequently returned to the atmosphere through evaporation and plant transpiration. Water that percolates below the root zone and reaches the saturated zone may contribute to aquifer recharge.
Runoff & Streamflow: How Rainfall Becomes River Flow
When precipitation reaches a watershed, it follows several pathways. Some water is intercepted by vegetation, some infiltrates into the soil, some is temporarily stored on the land surface, and some eventually reaches streams and rivers. The portion that reaches the drainage network contributes to runoff and streamflow.
The response of a watershed to rainfall is controlled by both the storm characteristics and the physical characteristics of the catchment. Rainfall intensity, duration and distribution interact with soil infiltration, antecedent moisture, topography, vegetation, land use and drainage characteristics to determine how much runoff is generated and how quickly it reaches the watershed outlet.
This rainfall–runoff response is fundamental to practical hydrology. Engineers use it when estimating design discharge, flood peaks, drainage requirements, culvert and bridge capacity, reservoir inflows and watershed response.